(+44) 7842798340
Call us for enquiry
-
-
Connect On Whatsapp (+44) 7842798340
Uninterrupted Access 24x7, 100% Confidential. - Connect Now

It is not necessary that you will get the desired outcomes when you deal with statistical insights. This is the reason that most users choose SPSS data analysis to deal with these perceptions. There might be situations when individuals will have shrouded tendencies in making some decisions, then a unique statistical test is used which is known as the Chi-Square test to know the difference between the expected and unexpected results. Unlike other statistical tests, it does not work with the mean instead, it deals with the frequency of the data. This blog post is all about the Chi-Square test in research, how to use it, when to use it, and much more. Let's read further.
Researchers generally use this test to determine whether to hold on to the null hypothesis or to the problem of the research. The main purpose of the test is to establish a relationship between two categorical variables. For performing any data analysis test, a researcher needs to make a research plan including test statistics, significance level, etc. It must reflect how you are going to accept or reject the null hypothesis.
For example, if you are going to perform the chi-square test to check whether the two categorical variables are independent then you need to cross-check the following requirements for the analysis:
Let us understand the working of the chi-square test with an example. Let’s say you conducted a survey among the students of a classroom to know how many of them like to eat Italian food. So you collected data to investigate it and find some patterns out of it. Let’s say you got the following data:
| Type of participants | Like to eat | Don’t like to eat |
|---|---|---|
| Girls | 32 | 38 |
| Boys | 30 | 12 |
| Total | 62 | 50 |
| Percent Value | 55.4% | 44.6% |
By looking at the data we can say that there is no mean value to work upon, which means the data is purely categorical in nature. Hence you need to use the test for performing the data analysis which works with the countable data, not with the mean values of the data, and the chi square test SPSS fits the current situation. So as per the test, the problem statement is:
Null hypothesis: There is no significant difference between Italian food preferences and gender.
Alternative hypothesis: There is a significant difference between Italian food preference and gender. Here, the chi-square test formula can be represented as
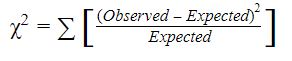
Now here comes the question, what is the value of the expected mean for our data? How can we calculate it? Prior to that, we have to form the null hypothesis stating that the candidates who like to eat Italian food are independent of gender. Now let us find the expected frequencies. The expected frequency for the girl candidates who love to eat Italian food (Girl- Like to eat) is (70/112) * (62/112) = 38.75. Likewise, other expected frequencies are found to be Girl- Don’t like to eat = 31.25, Boy- Like to eat = 23.25, and Boy- Don’t like to eat = 18.75.
Hence the value of the chi-square will be 7.02 by the above-mentioned formula. Now we have to determine whether the calculated value is statistically significant or not and to determine this, compare this value with the critical value of the distribution. Here you will need the degrees of freedom which can be calculated as (number of rows -1) * (number of columns - 1).
Now let us understand the results, that is, if the calculated value is greater than the critical value then we will say that there is a lack of independence. Here in our case, the calculated value exceeds the critical value with 1 degree of freedom and with 5% of the level of significance. Hence, we will reject our null hypothesis, that is, Italian food eating is not independent of gender.
Generally the chi-square test is used when you have nominal data and here you determine the statistical significance between the observed and expected frequencies. The Chi-square test has some limitations also, which are as follows:

The chi-square analysis is widely used in the field of medicine where it is useful for identifying the performance of a drug and it is easily carried out by the SPSS software. Hence the researchers try to get SPSS help when they are working on a study. We hope this blog made some sense to you and it is helpful to you to get better insights about the chi-square test. Wish you good luck with your data analysis!