(+44) 7842798340
Call us for enquiry
-
-
Connect On Whatsapp (+44) 7842798340
Uninterrupted Access 24x7, 100% Confidential. - Connect Now

A chi-squared test is written as the χ² test, which is a statistical analysis hypothesis testing method. The basic idea behind this test is to examine whether your data is as expected or not. This Chi-square test compares the observed values in your data to the expected values to check if the null hypothesis is true. This article provides a scope to understand Chi-square distribution in a data set to analyse the significance level and degree of freedom.
It is considered that like all other non-parametric statistically significant methods, the Chi-square is one of the robust concerns in the distribution of the data. It is observed that it does not need equality of nominal variables among the study groups that exist in the data. The best part about the test is that it gives the permission to evaluate both independent variables and multiple group studies. All these advantages make the test very suitable for the analysis. It is seen that the random sample that are passed through the test are very high and it is all due to the benefits given by it.
It is observed that the test is very sensitive to the sample size. It is seen that the relationship appears in the ray of significance when they are not being simple. It is all because of the large number of samples that are being used for the analysis. Sometimes it is seen that calculate the test statistic gets complicated due to large data. Along with all these points the text is also not capable of establishing the fact that whether there is a casual relationship between one variable with the other one. It is only capable of telling whether there is a relationship between two variables. Make sure to avoid the limitations.
Two different types of Chi-Square Tests are being used for the data analysis. The first one is the Chi-Square goodness that is regarding the fit test and the second one is the Chi-Square regarding the test that is of independence. The similarity between both tests is that they include variables that are dividing your data into two different categories. Both tests can calculate the expected frequencies that are based on their capacity and ability. Do not feel that these tests are the same as they all have similar names and the same distribution. Every test is different in terms of many aspects. It is very essential to know these forms of the test to have clarity related to all the areas.
This Chi-Square statistic is commonly utilised to test the interrelationships between the categorical variables. The null hypothesis of the Chi-Square test refers to that, no relationship exists on the categorical variables in the population; and they are independent of each other. There are mainly three types of Chi-square tests, which are tests of goodness of fit, independence and homogeneity. Chi-square is non-symmetric, where two non-negative integers are considered to explore the value of Chi-square. There are many different chi-square distributions, one for each degree of freedom, and for example, if the population variance is one, n=1.
The Chi-square goodness of fit test is suitable to identify whether the sample data matches the population or not. On the other hand, the Chi-square test for independence indicates the comparison between two variables in contingency tables to see they are related or not. Hence, through this chi-square test, it is possible to analyse the distribution of the categorical variables that differs from each other. The p-value can be explored through the Chi-square test where it is helpful to analyse the test result is significant or not. The alpha level (α) is chosen by the researchers where the level is 0.05 (5%), and it has the levels like 0.01 or 0.10.
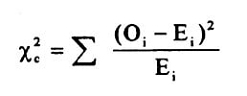
Hence, the chi-square test is mainly calculated by evaluating the cell frequencies which is involved with the expected frequencies in those types of cases, when there is no association between the variables. Through the comparison between the expected type of frequency and the actual observed frequency is then made in this test, it is also possible to analyse the independent variables in the data set.
It has been explored that, Chi-square statistical consulting measure for the researchers to analyse the differences between the observed values and expected values. The quantitative data analysis is mandatory to gather authentic data directly from the respondents and it will further provide an opportunity to the researchers to calculate the variances in expected and observed values. The significance level of the independent variable can also be evaluated further through this chi-square statistical test. Hereby, for critical evaluation of the independent and dependant data in the data set, it is helpful for the researchers to utilise the chi-square test to explore the p-value of 0.05 or greater for testing the final hypothesis.
Chi-square tests can be run on either Microsoft Excel or Google Sheets, we at SPSS-Tutor experts help you with software packages too that are more intuitive to run the test.