(+44) 7842798340
Call us for enquiry
-
-
Connect On Whatsapp (+44) 7842798340
Uninterrupted Access 24x7, 100% Confidential. - Connect Now

Discriminant analysis is a statistical technique used to compare effectiveness, understand the profits and losses, and set the best practices and recommendations. The target of this analysis is to determine the detectable difference between products. The Discriminant command in SPSS performs the canonical linear Discriminant analysis. It is based on linear combinations of the predictor variables. The Discriminant function analysis, linear function analysis are all generalised terms of Fisher's linear Discriminant. LDA is very closely related to ANOVA and regression analysis. In ANOVA there is the use of categorical independent variables and a continuous dependent variable, whereas Discriminant analysis has continuous independent variables and a categorical dependent variable. The analysis is done by creating one or more linear combinations of predictors. The purpose of Discriminant analysis is to maximally separate the groups and predict a classification based on the independent variables.
A Discriminant score can be calculated based on the weighted combination of the independent variables Di = a + b1x1 + b2x2 +…+ bnxn
Here, Di is the predicted score (Discriminant score)
x is predictor and b is the Discriminant coefficient
The discriminant test is considered to be a way to determine the most amazing differences between two or more than two groups. The statistical modelling is also playing its part in making the test very beneficial. It is said that statistical significance tests with the help of using chi-square allow the investigator to check how well the different functions are separating the groups. Lastly, the discriminant test is also something that enables the investigator to do the test theory of whether the cases are being classified in the way they are being predicted. It is rightly said that the advantages of discriminant analysis are very good in comparison to the other tests. It is a very popular test.
It is a fact that discriminant analysis offers several benefits to the ones who use it in their research process. But, along with that, some disadvantages are also associated with the use of the test which must be known to everyone. The first is the assumption of normality which means that the discriminant analysis assumes that all the predictors are distributed very normally. The second one in the line is the assumption related to the Equal Covariance Matrix which states that there are equal groups and if the prediction does not match then it leads to inaccuracy in the classification. It is assumed that spss data analysis is one of the most relevant forms of analysing the data.
It is considered that discriminant analysis is a structure that is the culmination of methods that can be used for classification and reduction. Talking about linear discriminant analysis then it is particularly famous and in use because it has the ability of being both a classifier and the reduction technique. Whereas the quadratic discriminant analysis is said to be a variant of LDA that enables non-linear separation of the entire data. It is observed that statistical test is very popular among researchers as they want to be sure whether the data collected by them through several sources is authentic or not.
It is considered that all statistical procedures are useful in several places. Firstly, it is very helpful in the procedures related to the diagnosis of a health issue. It is also good to assess the efficacy of the analysis. The analysis is being used in terms of getting the cross-validation to assess the probability of the classification. It is always suggested to the ones who use this analysis that they should use it in the set functions. It is said that machine learning with spss is a very good idea as it gets the best solutions to the issues. A test needs to be efficient enough to provide the most relevant outcomes that can be used in the research.
The assumptions of Discriminant analysis are very same as those for MANOVA.
Discriminant analysis is to predict group membership from a set of predictors. Thus, DA is MANOVA turned around.
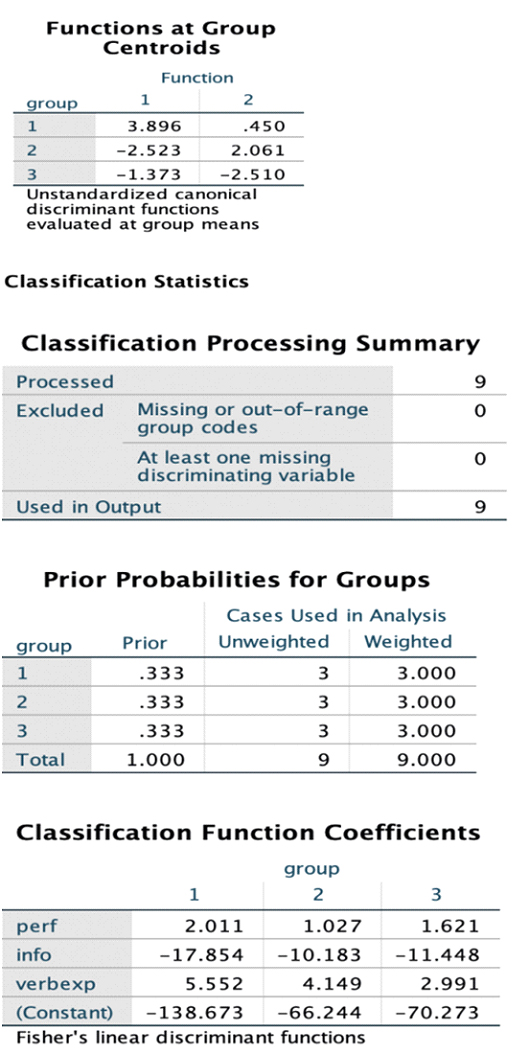
Research question: Do PERF, INFO, VERBEXP permit the classification of students by types of learning disabilities?
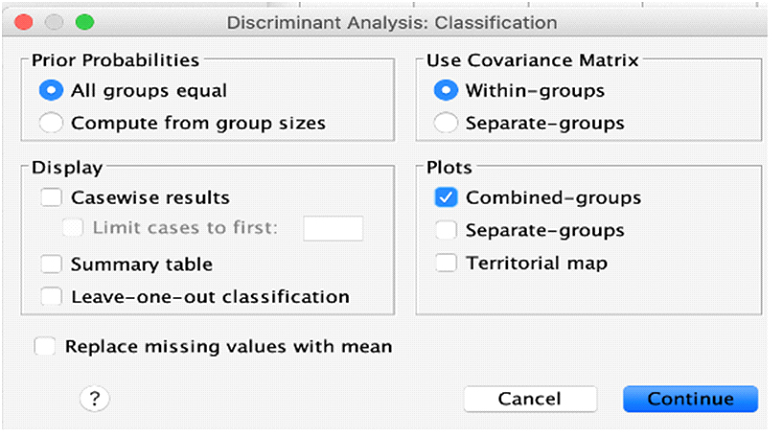
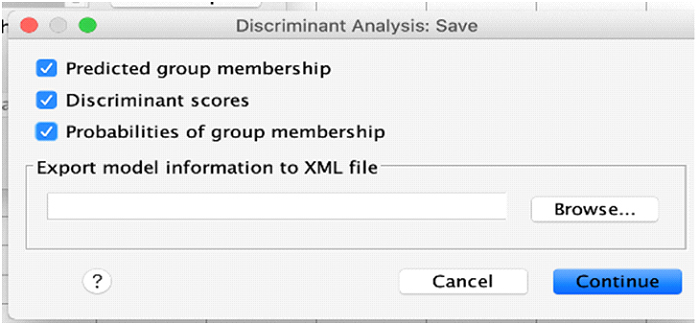
Open SPSS then: