What are Regression Analysis and Why Should we Use this in data research?
Introduction
Regression analysis is widely utilised with SPSS help for data analysis and interpretation in order to in statistical modelling, regression analysis is a set of statistical processes for estimating the relationships between a dependent variable and one or more independent variables. Through this article, it is possible to understand regression analysis and its importance in data research.
Regression
The formula of regression is,
For linear regression analysis, it is,
Y = a + bX
Where X is the explanatory variable
Y is the dependent variable
b is the slope of the line
a is the y-intercept
For regression analysis, the formula is,
Y = f (X, ß) + e
Where,
Y is the dependent variable
X is the independent variable
f is the function
ß is unknown parameter
e is the error term
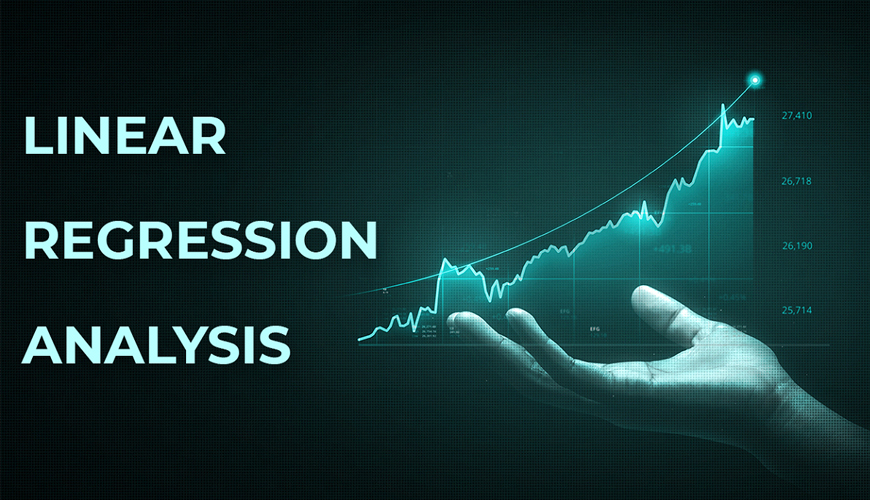
These are the main formula, through which the researchers can interpret the data findings for further discussion. Through the regression analysis, it is possible to identify the correlation analysis between the decedent and independent variables as well as consider the error in case of any errors in the data. The major types of regression are such as linear, logistics, polynomial, Bayesian linear model, lasso and ridge regression analysis. Correlation quantifies the strength of the linear relationship between a pair of variables in the data set, whereas regression expresses the relationship in the form of an equation. Hence, the above-mentioned equations are utilised for analysing regression and exploring the inter relationship between two variables in the data set. the above-mentioned equation indicates that the dependent variable will be changing with different values of the independent variables and through statistical analysis, the researchers can identify the interlink between the variables.
The sign of regression coefficient indicates that, whether there is a positive or negative correlation between each independent variable and the dependent variable in the data set. A positive coefficient states that, as the value of the independent variable increases, the mean of the dependent variable also tends to increase. Like this, if the sign of the coefficient is negative, it further indicates that there is a negative relationship between the independent and dependent variable, such as if the independent variable tends to increase, the dependent variable will tend to decrease.
For regression analysis, the following steps are helpful, which are,
- Modelling the multiple independent variables
- Including continuous and categorical variables
- Using polynomial terms to model the curvature
- Assessing interaction terms for determining whether the effect of one independent variable depends on the value of another variable
Through an excel spreadsheet as well as SPSS; it is possible for the data researchers and analysis to conduct the regression and correlation coefficient data for identifying the relationship between the independent and decedent variables in the set.
Importance of regression in data research
After that, the third chapter is for data research and analysis, the regression analysis is effective for the business researchers and statistical data analysis as well as it is also useful for the social researchers and public service analysis where the data analysts and researchers try to explore relationship as well as develop effective decision for achieving future success. Understanding the patterns is possible through regression analysis to explore new insights. The data set is effectively handled to perform regression analysis and it further helps the data analysts to conduct the researches efficiently for exploring the relationship between the dependent and independent variables. Optimising the process and correcting errors are also possible through the regression analysis, where the organisational representatives and the researchers are efficient to handle the large data sets and consider all the variables which have influential power in the data sets. Regression analysis is one of the reliable methods for identifying which variables have an impact on a topic of interest and it further provides a scope to the researchers to analyse the research topic by considering the data set, developing hypotheses with the alternative and null hypotheses and conducting regression analysis for testing the hypothesis.
Summary
It can be stated that regression analysis is useful for researchers and data analysts to analyse the interlinkage between the variables in the data set. The SPSS data analysis is effective to store and sorting the data with a multivariate system. The multivariable can be sorted and handled efficiently and the regression analysis in this regard is useful to analyse the data for evaluating the relationship between the independent and decedent variables in the data set. For the social researches, such as medical, health and social care, engineer and business field, the researchers try to analyse different variables and evaluate the relationship between two variables for better data findings and discussion, so that ultimate decision can be taken proficiently.

